Introduction to Analytics

Analytical methods & powerful tools

Analytics are used to organize data, extract information, visualize (make it accessible) results, and communicate findings.

New to analytics or need a quick refresher? Check out our Intro to Analytics video for a brief overview of analytics and discussion on why firms invest in analytics. For more detailed information on analytics, read on.

01 — Descriptive Analytics

What happened?

Descriptive analytics is a collection of methods used to transform raw data into meaningful information. Analysts use descriptive methods to explore past data, measure performance, and monitor Key Performance Indicators (KPI's) in real-time. Descriptive methods involve applying simple statistical measures to the data and often include counts, proportions, means, standard deviations, percentages, and percentiles.

Descriptive analytics data visualization
02 — Diagnostic Analytics

Why did it happen?

Diagnostic Analytics address why events or outcomes have occurred in the data. Building on the information gained by applying descriptive analytics, diagnostic methods go a step further by answering the question: Why did this happen? By using diagnostic methods, organizations can explain the information found in descriptive analytics. Standard diagnostic tools include comparing distributions across categories, investigating covariances and correlations, geographic analysis, and assessing changes across time.

Correlation scatter plots Geographic analysis map
03 — Predictive Analytics

What will happen?

Experimental Methods

A controlled scientific experiment is used to test and identify how factors affect behavior, a process, or an issue. Experiments are used to generate meaningful data that often reveal the true impact of a factor and allow the organization to draw meaningful conclusions.

Experiment animation
  • Digital marketing - A/B testing
  • Promotions
  • Email and website design
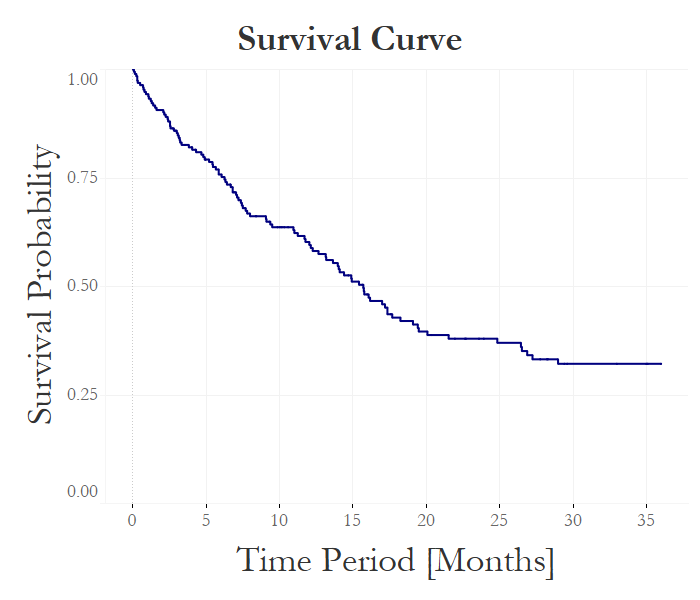
  • Employee retention
  • Customer retention

Statistical Modeling

Statistical modeling begins with the identification of a problem, a goal, or a hypothesis. Then a mathematical model is developed to formalize relationships among a collection of factors (variables or attributes) that influence the issue at hand. We then use data and statistical methods to quantify these relationships and assess whether statistical or economic significance is present. Based on the statistical findings, an action plan is developed to achieve the goal or overcome the problem.

Survival analysis and statistical modeling charts
  • Regression
  • Logistic Regression
  • Forecasting
  • ANOVA
  • Survival Analysis
  • Time Series Analysis
04 — Prescriptive Analytics

What should we do?

Prescriptive Analytics is the formulation of an action plan to prescribe a treatment for a problem or improve an outcome. These analytics use the insights and information learned from descriptive, diagnostic, and predictive methods to generate a detailed action plan. In addition to the action plan, Prescriptive Analytics describes how much the action will cost and how the organization will benefit.

Prescriptive analytics framework

Would you like to find out more?

Let's talk about how these methods apply to your organization.

Contact us